
From Empathy Maps to Powerful Personas
A Practical Guide for Product Teams
FEATUREDUX
Linda Rasip
11/14/20258 min read


From Empathy Maps to Powerful Personas
How to transform raw user insights into actionable personas that drivebetter product decisions
The Problem with Traditional Personas
We've all seen them—those beautifully designed persona posters gathering dust in the corner of the office. "Marketing Mary" with her stock photo and suspiciously perfect demographic details. The personas that everyone nods at during kickoff meetings but completely ignores when making actual product decisions.
Why? Because they're often built on assumptions rather than real empathy.
Here's the truth: A persona without empathy is just demographic fiction. But a persona built from genuine user understanding? That's a tool that can transform how your team builds products.
The secret is starting with empathy maps—and I'm going to show you exactly how to do it.
What Makes Empathy Maps Perfect for Persona Development
Before we dive into the "how," let's understand "why" empathy maps are the ideal foundation for personas.
Empathy maps are:
Structured yet flexible - They organize insights without constraining thinking
Collaborative - Your entire team can contribute, not just researchers
Fast to create - You can generate one in 30-60 minutes per user segment
Action-focused - They naturally lead to design implications
User-centric - They force you to see through your users' eyes
Unlike jumping straight to persona creation (which often leads to premature conclusions), empathy maps help you synthesize raw research data first. They're the bridge between your interviews, observations, and analytics—and your final personas.
The Four Quadrants: Understanding the Empathy Map Framework
The classic empathy map has four quadrants that capture different dimensions of the user experience:
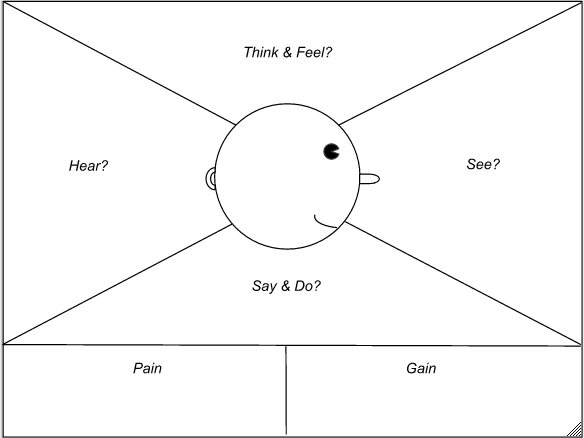
1. SAYS - Direct Quotes & Statements
What users explicitly tell you during interviews, surveys, or feedback sessions.
Example:
"I check my email at least 50 times a day"
"I'm drowning in project management tools"
"I don't have time to learn another platform"
2. THINKS - Internal Thoughts & Beliefs
What users are thinking but might not say out loud. You infer this from tone, body language, and reading between the lines.
Example:
"Am I the only one struggling with this?"
"My boss will think I'm incompetent if I ask for help again"
"There must be a better way to do this"
3. DOES - Observable Behaviors & Actions
What you actually see users doing—their workflows, workarounds, and habits.
Example:
Keeps three browser tabs open to accomplish one task
Takes screenshots and saves them in a folder labeled "Remember This"
Checks phone notifications during meetings every 3-5 minutes
4. FEELS - Emotions & Emotional States
The emotional journey—frustrations, anxieties, delights, and fears.
Example:
😤 Frustrated when tools don't sync properly
😰 Anxious about missing important updates
😊 Satisfied when finishing a project on time
Some empathy maps add two additional sections:
PAINS - Specific frustrations, obstacles, and challenges
GAINS - Goals, aspirations, and desired outcomes
Step-by-Step: Building Personas from Empathy Maps
Phase 1: Gather Your Research Data (Before You Map)
Before you can create empathy maps, you need research. Here's your data collection checklist:
Qualitative Sources:
User interviews (10-15 per segment minimum)
Contextual observations (watch users in their environment)
Customer support ticket analysis
Sales team insights (what do prospects ask?)
User testing sessions with think-aloud protocol
Quantitative Sources:
Product analytics (behavior patterns, feature usage)
Survey results (quantify preferences and pain points)
Demographics and firmographics (B2B)
Pro tip: Don't skip the qualitative research. Analytics tell you what users do; empathy requires understanding why.
Phase 2: Create Individual Empathy Maps
Estimated effort: 1-2 hours
Start by creating empathy maps for individual users you've researched. This is crucial—don't jump to aggregating yet.
What you'll need:
Large sticky notes or digital whiteboard (Miro, FigJam, Mural)
Interview transcripts or notes
Your research team (2-4 people ideal)
Colored markers or digital equivalents
The Process:
Choose one interview participant Start with someone who gave you rich, detailed insights.
Draw your four quadrants Create a large cross dividing your space into four equal sections. Label them: SAYS, THINKS, DOES, FEELS.
Add a user sketch in the center Draw a simple face or circle in the middle. Write the participant's first name (or pseudonym) and a brief descriptor.
Fill each quadrant systematically
SAYS Quadrant:
Review your interview transcript
Pull direct quotes verbatim
Focus on statements about behaviors, needs, and frustrations
Write each quote on a separate sticky note
Example from a project management tool interview:
"I spend more time updating status than actually doing the work"
"My team uses three different tools and nothing syncs"
"I need to see everything at a glance"
THINKS Quadrant:
What were they thinking but not saying?
Read between the lines of their responses
Consider their tone, pauses, and hesitations
Note beliefs and assumptions they revealed
Example:
"I should be able to figure this out on my own" (said with embarrassment)
"Other people probably don't have this problem" (when describing workaround)
"If I complain, I'll look like I can't keep up" (defensive tone when explaining)
DOES Quadrant:
Document observed behaviors
Include workarounds and coping mechanisms
Note tools and processes they use
Capture frequency and patterns
Example:
Opens email every 10 minutes to check for updates
Maintains personal spreadsheet to track what's in which tool
Screenshots important information "just in case"
Works late evenings to catch up on administrative tasks
FEELS Quadrant:
Note emotional language from the interview
Add emotional cues you observed (sighs, excitement, frustration)
Map emotional highs and lows during their typical workflow
Use emotion words and emojis
Example:
😤 Frustrated when switching between multiple tools
😰 Overwhelmed by notification volume
😓 Exhausted from context-switching
😊 Relieved when a project finally closes
😎 Proud when delivering ahead of schedule
5. Add PAINS and GAINS (optional but recommended)
Below your four quadrants, add two sections:
PAINS:
Biggest obstacles
What keeps them from success
Costs (time, money, frustration)
GAINS:
What success looks like
Desired outcomes
Metrics that matter to them
Phase 3: Create Multiple Empathy Maps
Estimated effort: Half day
Repeat the process for 3-15 different users from your research. This is essential for pattern recognition.
Why multiple maps?
You'll start seeing patterns emerge
You'll identify distinct user segments
You'll catch outliers and edge cases
You'll build confidence in your findings
Organization tip: Use different colors for different potential segments. For example:
🔵 Blue for "power users"
🟢 Green for "newcomers"
🟡 Yellow for "sporadic users"
Phase 4: Identify Patterns & Clusters
Estimated effort: 2-3 hours
Now comes the magic—finding patterns across your individual empathy maps.
The Clustering Workshop:
Spread out all empathy maps Put them on a wall or digital canvas where everyone can see them.
Look for commonalities Ask your team:
Which SAYS statements appear repeatedly?
Which DOES behaviors show up across multiple users?
Which FEELS emotions are universal vs. specific?
Which PAINS are most frequent and severe?
Create affinity groupings Start physically moving maps near each other that share similarities:
"These three users all mention time pressure"
"These five users all use workarounds for the same problem"
"These four users all feel overwhelmed by notifications"
Identify distinct segments You should start seeing 3-5 clear clusters emerge. Users within each cluster:
Share similar goals
Experience similar pain points
Exhibit similar behaviors
Have similar attitudes and emotions
✅ What good clusters look like:
Distinct - Clear differences between clusters (>30% behavioral variance)
Substantial - Each represents significant portion of users (>10%)
Actionable - Different clusters need different product approaches
Validated - Patterns confirmed across multiple data sources
❌ Red flags:
Too many clusters (>6) - probably over-segmenting
Too few clusters (1-2) - probably over-generalizing
Clusters based only on demographics - missing behavioral differences
One person per cluster - these are individuals, not personas
Phase 5: Create Aggregated Empathy Maps
Estimated effort: 2-3 hours
For each cluster, create a composite empathy map that synthesizes insights from all the individual maps in that group.
Process:
Start fresh with a new empathy map template
Synthesize the SAYS quadrant
Identify the most common statements (mentioned by >50% of users in cluster)
Include the most powerful or revealing quotes
Aim for 5-8 key statements that represent the group
Synthesize the THINKS quadrant
What beliefs do most users in this cluster share?
What assumptions unite them?
What internal narratives are consistent?
Synthesize the DOES quadrant
What behaviors are universal to this cluster?
What workflows do they all follow?
What tools do they all use (or avoid)?
Synthesize the FEELS quadrant
What emotions are most prevalent?
Map the emotional journey this cluster experiences
Identify emotional peaks (positive) and valleys (negative)
Consolidate PAINS and GAINS
List the top 5 pains (by frequency and severity)
List the top 3-5 goals or desired outcomes
Prioritize what matters most to this group
Critical rule: Everything on the aggregated map must be backed by actual research data, not assumptions or stereotypes.
Phase 6: Transform Empathy Maps into Full Personas
Estimated effort: 1 day
Now you're ready to build comprehensive personas. The empathy map provides the emotional and behavioral core; you'll add structural elements to make it complete.
For each aggregated empathy map, create a persona document:
Header Section
Name: Give them a memorable name - Alliterative works well: "Strategic Sarah," "Tactical Tom" - Use real first names, not generic role names
Photo: Choose an authentic-looking stock photo - Should reflect demographics from research - Avoid overly corporate or posed shots
Role: Their job title or life role - Be specific: "Product Manager at Series B SaaS" - Not generic: "Professional"
Tagline: One sentence from their perspective - Example: "I need to coordinate three teams without drowning in status updates"
Demographics
(brief - don't overemphasize)
Pull from your research data:
Age range
Location type (urban/suburban, or region)
Education level (if relevant)
Experience level
Company size (B2B) or household situation (B2C)
Goals & Motivations
(FROM YOUR EMPATHY MAP'S GAINS)
Transform the GAINS section into 2-3 specific, measurable goals:
From empathy map:
Gain: "Complete projects faster"
In persona:
Primary Goal: Reduce project completion time by 20% to take on more high-value clients
Why it matters: Each additional project = $15K revenue, and wants to hit $200K this year
Pain Points
(FROM YOUR EMPATHY MAP'S PAINS)
Transform the PAINS section into detailed pain point descriptions:
From empathy map:
Pain: "Too much tool-switching"
In persona:
Pain Point #1: Wastes 6+ hours weekly switching between Asana, Slack, Google Drive, and email to track project status
Impact: Missed deadlines, forgotten tasks, client dissatisfaction
Current workaround: Maintains personal Excel spreadsheet (which gets out of sync)
Emotional toll: Constantly anxious about forgetting something important
Behaviors & Patterns
(FROM YOUR EMPATHY MAP'S DOES)
Create a structured "current state workflow" section:
From empathy map:
Does: Opens email every 10 minutes
Does: Takes screenshots of important info
Does: Checks three different tools
In persona: Daily Workflow:
Starts day reviewing overnight emails (20-30 min)
Opens Asana, Slack, Drive to see what's changed
Spends 30 min updating status across tools
Throughout day: checks email every 10 min, Slack every 15 min
End of day: 45 min "catch-up time" consolidating information
Tools Used:
Asana (task management) - checks 4-5x daily
Slack (team communication) - always open, checks constantly
Google Drive (file storage) - uses for client deliverables
Gmail (external communication) - 50+ checks daily
Psychographic Profile
(FROM YOUR EMPATHY MAP'S THINKS & FEELS)
Transform the internal thoughts and emotions into personality traits and attitudes:
From empathy map:
Thinks: "I should be able to handle this"
Feels: Frustrated, overwhelmed, anxious
In persona: Personality:
Self-reliant: Prefers to figure things out independently before asking for help
Perfectionist: High standards for own work, anxious about mistakes
Collaborative: Values team input but struggles with coordination overhead
Attitudes:
Toward technology: Pragmatic adopter - willing to try new tools if they solve real problems
Toward change: Cautiously open - will change processes if clear benefit
Toward risk: Conservative - needs proof before committing
Technology Profile
Describe their tech savviness and preferences:
Skill level: Intermediate (comfortable with standard business software)
Primary device: MacBook Pro (work), iPhone (mobile)
Learning style: Prefers video tutorials and trial-and-error over reading documentation
Adoption pattern: Early majority - waits for tools to prove themselves
Quotes
(FROM YOUR EMPATHY MAP'S SAYS)
Pull 2-3 of the most powerful direct quotes:
"I spend more time telling people what I'm doing than actually doing it."
"If I could see everything in one place, I'd get back hours every week."
"I'm constantly afraid I've missed something important buried in Slack."
A Day in the Life Narrative
Write a 200-250 word story that brings together elements from all quadrants of your empathy map:
Sarah opens her laptop at 7:30am, already feeling behind. She starts with email. 32 new messages overnight, mostly project updates scattered across five different client threads. She quickly scans for anything urgent while her coffee brews.
By 8am, she's in Asana checking her task list, but realizes three tasks are actually being discussed in Slack channels she hasn't checked yet. She opens Slack have 127 unread messages. Her anxiety spikes. "I can't keep up with this," she mutters. She spends the next 30 minutes trying to synthesize information from Asana, Slack, email, and Google Drive to understand where each project actually stands. She updates her personal "master spreadsheet" which the only place where she has a complete picture.
At 9am, her first client call. She's scrambling to pull together status from four different sources. During the call, her Slack notifications keep popping up. Other projects need attention. She feels divided, unable to give anything her full focus.
By noon, she's exhausted from context-switching, and she hasn't even started on actual client deliverables yet...